|
| |
|
|
Dear Shareholders,
On behalf of the Board of Directors, we are pleased to present the Annual Report and Audited Financial Statements of JcbNext Berhad ("JcbNext" or "the Group") for the financial year ended 31 December 2025.
FINANCIAL PERFORMANCE
For FY2025, the Group recorded revenue of RM20.37 million, profit before tax of RM43.66 million, and profit attributable to shareholders of RM43.13 million. Revenue increased by 39.4% year-on-year, while profit before tax and profit attributable to shareholders declined by 15.7% and 15.6% respectively. Despite the lower reported profit, the Group ended the year in a stronger financial position, with net assets increasing by 12.8% to RM450.73 million and book value per share rising to RM3.44 from RM3.04 a year earlier.
A key positive in FY2025 was the continued growth in dividend income from our equity investments. Dividend income rose to RM16.38 million, up 64.5% from RM9.96 million in 2024, and was the main driver of revenue growth during the year. This is encouraging because it reflects progress in building a portfolio of quality investments that can generate recurring cash flows over time. It also helps broaden the Group's income base and gradually reduces reliance on any single investment.
At the same time, it is important to distinguish between recurring income and non-recurring gains. During the year, the Group realised gains of RM30.92 million from the disposal of 104 Corporation ("104 Corp") shares, which accounted for a substantial portion of FY2025 net profit. These disposals were undertaken as part of our on-going effort to manage concentration risk and rebalance the portfolio. While they contributed meaningfully to earnings this year, such gains are not expected to recur indefinitely and should be viewed separately from the Group's underlying income generation.
Other components of revenue, namely interest income, investment distribution income and rental income, collectively declined by 14.3% year-on-year. Meanwhile, operating expenses increased to RM10.22 million from RM7.89 million in the previous year, due mainly to higher foreign exchange losses. These losses arose largely from the Group's foreign currency deposits as the US dollar weakened against the Malaysian ringgit during the year.
From a balance sheet and liquidity perspective, the Group remains well positioned. As at 31 December 2025, total assets stood at RM458.19 million, while cash and short-term investments in money market funds totalled RM148.37 million. This financial strength gives us flexibility in capital allocation and supports our ability to continue investing with discipline while returning cash to shareholders.
DIVIDEND
The Board is pleased to propose a final single-tier dividend of 7.25 sen per share for FY2025, subject to shareholders' approval at the forthcoming Annual General Meeting. This reflects the Board's confidence in the Group's financial position and cash-generating ability. For FY2024, an interim single-tier dividend of 7.0 sen per share was paid on 31 December 2024.
CORPORATE DEVELOPMENTS
In 2025, the Group continued to add to its equity investment portfolio, investing RM31.50 million during the year. This was below the RM61.11 million invested in 2024, reflecting our disciplined approach to capital deployment. We do not invest for activity's sake. Rather, we remain patient and selective, with a focus on acquiring quality businesses at valuations that offer an attractive margin of safety and long-term return potential.
The Group also disposed of certain investments amounting to RM7.75 million during the year, excluding disposals of 104 Corp shares. These disposals were driven by portfolio rebalancing and changes in the fundamentals of the underlying businesses. Our approach remains that of a long-term investor. We do not engage in short-term speculative trading, and we continue to manage the portfolio with an emphasis on durability of returns, cash flow generation and risk control.
I would like to take this opportunity to welcome Mr. Goh Kok Ghee to our Board of Directors. He joined the Board in February 2026 as an Independent Director, bringing with him over 27 years of diverse leadership experience across digital marketplaces, online recruitment, renewable energy and manufacturing, as well as strong track record in business transformation and operational excellence.
At the same time, we bid farewell to Mr. Teo Koon Hong, who resigned from the Board in February 2026. Since joining the Board in 2015, Mr. Teo has been a strong and independent voice, providing invaluable perspectives and consistently challenging Senior Management to raise the bar in pursuit of higher standards. We are pleased that Mr. Teo will continue to contribute to the Group in his capacity as a director of our Singapore subsidiary.
Earlier, in May 2025, Mr. Lim Chao Li also resigned from the Board. Mr. Lim was a co-founder of the JobStreet.com business together with Mark and Mr. Ng Kay Yip, and had served on the Board of the Company since its incorporation in 2004. Over the years, he has played an instrumental role in providing leadership, guidance and invaluable counsel to the Board and Senior Management.
On behalf of the Board, I would like to record our sincere appreciation and gratitude to both Mr. Teo Koon Hong and Mr. Lim Chao Li for their longstanding service and significant contributions to the Board and its various Committees. We wish them every success in their future endeavours.
OUTLOOK
Looking ahead, the external environment is likely to remain uncertain, with geopolitical developments, trade tensions and market volatility continuing to influence investor sentiment and asset prices. In such conditions, our priority is to remain disciplined in how we allocate capital and manage risk.
JcbNext will continue to focus on identifying resilient, well-managed businesses that are capable of generating sustainable returns over the long term. We believe that a patient, fundamentals-driven approach remains the best way to compound shareholder value over time. Backed by a strong balance sheet and healthy liquidity, we believe the Group is well placed to navigate uncertainty while continuing to pursue attractive long-term opportunities.
SUSTAINABILITY
The Group continues to support sustainable business practices in its operations and corporate activities. We are pleased to present our Sustainability Report in this Annual Report, which outlines our approach and initiatives in this area.
APPRECIATION
On behalf of the Board, we would like to express our sincere appreciation to our employees, business partners, advisers and shareholders for their continued support and confidence in the Group.
DATUK ALI BIN ABDUL KADIR
Chairman
|
|
| |
|
|
| LETTER FROM THE CHIEF EXECUTIVE OFFICER |
| |
|
|
Dear Shareholders,
The Year in Brief
FY2025 was a year in which our reported profits declined, but our underlying economic performance improved, albeit modestly. As I have noted in previous annual letters, standard accounting figures – while necessary – do not always provide the clearest picture of our business. Instead, we focus on three key measures:
- Growth in free cash flow (FCF),
- Growth in dividends per share (DPS), and
- Long-term growth in net asset value (NAV), loosely defined as all our assets valued at "market prices", less liabilities
On these measures:
- FCF increased marginally to RM18.7 million in 2025 (+3.3%)
- DPS from our FY2025 cash flow is expected to be RM 0.0725 (+3.6%)
- NAV grew to RM492.2 million at the end of 2025 (+5.8%)
These are not extraordinary numbers, but they represent steady progress.
A bit more details on how we came to these numbers:
1. Income Generation. Our assets produced dividends, interest and rental incomes of about RM27.7 million in 2025 before taxes, a 13.0% increase from RM24.5 million in 2024. This can be traced back to an increase in dividends from our new equity portfolio and higher interest income, but offset by a decrease in dividends received from 104 Corp due to a further reduction in our shareholding.
2. Management Costs. Staff costs and other operating expenses at our investment holding operations were RM3.7 million in 2025, an increase of about 4.7% from 2024. This excludes forex gains or losses. The RM3.7 million figure is about 0.8% of our 2024 year-end NAV of RM465.0 million.
3. Free Cash Flow (FCF). Deducting taxes and making some other adjustments, FCF generated by our business is estimated to have increased by 3.3% from RM18.1 million in 2024 to RM18.7 million in 2025.
4. Dividend Per Share (DPS). As with previous years, about 50% of our FCF is expected to be distributed as dividends, translating to about RM 0.0725 per share, slightly higher than the last dividend of RM 0.07.
5. Net Asset Value (NAV). As at 31 December 2025, the NAV of our company stood at RM492.2 million, an increase of 5.8% compared to RM465.0 million at the end of 2024.
Accounting Figures v Underlying Economics
As mentioned, I am mindful that accounting rules can sometimes make performance appear better – or worse – than it truly is. The main objective of this letter is to provide a candid update on our business performance and strategy, so that you can assess whether JcbNext continues to be a suitable investment for you. As such, I encourage shareholders to look beyond reported profits and focus on the underlying economics of the business.
In particular, I would like to provide a clearer understanding of our reported revenue and profit figures. Our Group recorded a revenue of RM20.4 million in FY2025, an increase of 39.4% from RM14.6 million in FY2024. Net profit attributable to shareholders in FY2025 was RM43.1 million. These figures are accurate from an accounting standpoint, but in my view, they overstate the underlying performance of the businesses.
A significant portion of the RM43.1 million profit arose from a RM30.9 million accounting gain following the partial disposal of our Taiwan-listed associate, 104 Corp. As mentioned in last year's letter, our initial investment in 104 Corp dates back to 2008. The value from this investment was built steadily over many years – through the efforts of 104's management, as well as the foresight and patience of earlier teams at JcbNext who made and held the investment.
The recent disposal did not create new value in 2025. It simply converted a portion of that accumulated value into cash. In that sense, what is reflected in this year's profit is less about what was earned during the year, and more about value that had been built over a much longer period.
Meanwhile, the figure also includes unrealised foreign exchange losses of RM5.8 million. In my view, these do not reflect a deterioration in the underlying businesses we own. These losses arise mainly from the translation of foreign currency-denominated assets and results, and are driven by movements in exchange rates rather than changes in business fundamentals. Such movements can be volatile and are often temporary in nature. Over time, they may well reverse.
Our Objective
Back to our long-term aspirations. Our goals remain straightforward:
- To preserve purchasing power,
- To grow capital gradually,
- To deliver a stream of income through dividends
We are working towards these goals by attempting to build a diversified portfolio of businesses capable of generating cash over long periods, favouring smaller, distributed stakes over large, concentrated positions.
Our Assets
Our key assets (together with their market value as at the end of 2025) are as follows:
- Larger Business Investments (104 Corp, Lion Rock, Innity) – RM124.0 million;
- New Equity Portfolio (31 companies, 2 ETFs) – RM200.3 million;
- Wisma JcbNext – RM18.0 million;
- Other Investments – RM 5.6 million;
- Cash & Cash Equivalents – RM 148.4 million
Larger business investments
104 Corp in Taiwan remains our largest single position, with a market value of about RM81.1 million as at end-2025. The business delivered a 4.0% year-on-year increase in after-tax profit in 2025, continuing its track record of steady, consistent growth over the past few years. The company has once again announced its intention to distribute about 100% of its 2025 earnings as dividends, which we expect to receive later this year. As highlighted previously, 104's business model requires minimal reinvestment, enabling it to return the bulk of its earnings to shareholders like us.
In 2025, we received dividends of approximately RM6.4 million from 104 Corp, representing a dividend yield of about 17.8% on our Ringgit cost (inclusive of the appreciation of the TWD against the Ringgit). Our initial investment in 104 Corp in 2008 was part of a strategic effort to expand JobStreet's online footprint. The strong and growing dividends we receive today underscore the merits of long-term ownership of quality businesses run by capable management, combined with the discipline to remain patient. As Warren Buffett aptly observed: "Time is the friend of the wonderful company, the enemy of the mediocre."
Meanwhile, Lion Rock – the second largest, valued at RM36.3 million – reported a 12.5% decline in profit attributable to owners to HKD187.7 million in 2025. In my view, this performance remains commendable given the backdrop of tariff uncertainties and a softer illustrated book market. Much like 104 Corp, Lion Rock is led by a management team that has exceeded our expectations time and again in an industry that is often overlooked by outside observers. In 2025, we received dividends of around RM3.8 million from the company, translating to a yield of 21.3% based on our cost. These outcomes, more than capital gains, capture the true rewards of long-term dividend investing.
Over the last year, we sold down a portion of our holdings in 104 Corp and Lion Rock reluctantly. The decisions were driven almost entirely by our hope to diversify our portfolio further – the two companies collectively made up about 23.9% of our NAV as at the end of 2025. The shares were sold through open market transactions, and we believe the new owners can take justifiable pride in holding a stake in such outstanding businesses.
Nova Pharma
A special mention this year goes to Nova Pharma, and in particular the entrepreneur behind the company, Boo Wie, and his team.
We fully exited our 9.45% stake in January 2026 following a mandatory takeover offer. From this investment, we realised approximately RM5.2 million in proceeds, in addition to dividends of about RM1.4 million received over the years. Against our initial investment of RM2.0 million in December 2017 – made prior to the company's LEAP market listing – this translated into total cash returns of RM6.6 million, or a compounded annual return of approximately 16% over an eight-year holding period.
While not one of our larger positions, this has been one of our most emotionally rewarding investments. When we first invested, the company was generating less than RM3 million in profit after tax. Today, that figure has more than doubled. There was no financial engineering here – just steady, unglamorous execution over many years.
Boo Wie is the kind of entrepreneur we like to back. No grand offices, no unnecessary frills – just a focus on running a good business. I still remember seeing him pushing a trolley of food to the AGM room together with his staff. That tells you more about a person than any presentation deck. Over the years, he has also been generous with his time in helping me understand the business and the industry. We are grateful for the opportunity to have partnered with him.
Recalling our first meetings with the team, it is worth stating plainly: we did not invest out of optimism or projections – we invested because the price made sense. We came away with a favourable impression of the team and agreed on a valuation that met our return requirements. Otherwise, we would have walked away. We are prepared to provide patient capital, but not to overpay. Discipline at entry remains the most important determinant of outcome.
Opportunities like this are rare, and it may be some time before we encounter another. Several things must come together: a capable and trustworthy entrepreneur, a business with sound economics, and a price that offers a margin of safety. Most opportunities fail at least one of these tests – often more. When they do, we pass. When all three align, we act.
This investment is a good reminder of what we are trying to do: back the right people, at the right price, and then wait patiently.
New Equity portfolio
Over the past few years, our New Equity Portfolio has quietly grown into a meaningful part of our business. I will spend more time discussing this portfolio as I believe it will be most representative of our new investments going forward.
i) New Equity Portfolio – Investment Categories
| Category |
Market Value |
% of New Equity Portfolio |
Description |
| Dividend-oriented equities |
RM 106.3 m |
53.1% |
Established, cash-generative businesses |
| Growth equities |
RM 29.3 m |
14.6% |
Lower yield, higher reinvestment potential |
| Deep-value equities |
RM 52.1 m |
26.0% |
Steep discounts to intrinsic value, often unloved |
| ETFs & others |
RM 12.6 m |
6.3% |
Broad market exposure and diversification |
| Total |
RM 200.3 m |
100.0% |
|
ii) New Equity Portfolio – Geographic Exposure
| Region |
Market Value |
% of New Equity Portfolio |
| China/ Hong Kong |
RM 145.3 m |
72.5% |
| Malaysia |
RM 43.6 m |
21.8% |
| Others |
RM 11.4 m |
5.7% |
| Total |
RM 200.3 m |
100.0% |
iii) New Equity Portfolio – Sector Allocation
| Sector |
Market Value |
% of New Equity Portfolio |
| Financials (banks, insurance) |
RM 65.3 m |
32.6% |
| Technology/ Internet |
RM 36.7 m |
18.3% |
| Property |
RM 29.7 m |
14.8% |
| Others (industrial, consumer, etc) |
RM 68.6 m |
34.3% |
| Total |
RM 200.3 m |
100.0% |
iv) New Equity Portfolio – Portfolio Concentration
| Metric |
Value |
% of New Equity Portfolio |
| Number of holdings |
33 |
|
| Top position |
RM 21.3 m |
10.61% |
| Top 5 holdings |
RM 72.9 m |
36.41% |
| Top 10 holdings |
RM 118.2 m |
58.98% |
As at end-2025, this new equity portfolio comprises 31 companies and 2 ETFs, with a total market value of RM200.3 million, representing about 40.7% of our NAV. It remains tilted toward businesses with strong dividend-paying histories. Banking and insurance companies – primarily in China – account for about 32.6% of the portfolio (excluding "indirect" exposure via ETFs), followed by Chinese internet and technology companies at 18.3%, and Chinese/ Hong Kong property companies at 14.8%. Overall, this new equity portfolio is deliberately diversified, with the largest single position amounting to RM21.3 million.
In 2025, we continued to build our shareholding in publicly listed businesses across the Asia Pacific region. We made a net investment of RM 31.5 million during the year. Of this, RM15.0 million was deployed into several “deep value” opportunities in Malaysia, with the balance invested in Hong Kong/ China. This brings our total cost of investment in the New Equity Portfolio to RM175.0 million as at the end of 2025.
Our investments, broadly define
Overall, a large portion of the portfolio is invested in “dividend-oriented” equities: businesses that already generate steady cash flows and have a habit of sharing those cash flows with shareholders. These are often not the most exciting businesses, but they tend to be resilient, disciplined, and capable of producing reliable income over time.
Alongside these, we hold a smaller group of “growth” equities - businesses that reinvest most of their earnings to drive future growth. While they may not provide much income today, we value them for their ability to deploy retained earnings productively and generate higher cash flows over the long term.
We also include a third category, “deep value” equities - businesses that may currently be overlooked, misunderstood, or out of favour, often trading at prices that do not fully reflect their underlying value. These situations can require patience, but the main objective is not a quick re-rating; rather it’s to own assets where normalised cash flows in the future can be materially higher than what the current price implies.
Across all three categories, the common thread is a focus on long-term cash generation. Our goal is not to seek trading gains, but to own businesses that can produce and grow cash flows over time. This balance reflects a simple idea: We want income today, but we are also willing to wait for more income tomorrow.
Early, modest progress
In 2025, our New equity portfolio generated RM11.2 million in dividend after taxes – a decent jump from the RM5.9 million in 2024. This growth was mainly driven by more capital deployed into the portfolio, receiving full-year dividends from investments made in prior years, as well as one-off dividends from some of our portfolio companies.
Based on a cost base of RM175.0 million, our portfolio delivered an after-tax dividend yield of around 6.4% in 2025. This was largely supported by our dividend-oriented investments, most of which generated yields in the range of 5-10% on cost. The overall new equity portfolio yield, however, was on the lower end of that range, as it was moderated by our allocation to growth positions and ETFs, which typically pay little to no dividends.
Since we began building this portfolio in 2020, we have sold only RM15.1 million worth of investments. This is by design. Our portfolio turnover is, and will remain, meaningfully lower than that of a typical fund management firm.
As I have shared in previous letters: we view our equity investments as part-ownership in good businesses, with the and it’s our intention to hold them for the long term. We do not view them as a series of flashing stock tickers, arrows and numbers to be traded at every opportunity.
New Equity Portfolio – Income Growth
| Year |
Capital Invested (cumulative, net of sales) |
Dividend Income, after tax |
Dividend Yield, after tax (on cost) |
| 2023 |
RM 90.1 m |
RM 3.6 m |
3.94% |
| 2024 |
RM 147.5 m |
RM 5.9 m |
4.00% |
| 2025* |
RM 175.0 m |
RM 11.2 m |
6.42% |
* Excludes dividends affected by one-off changes in payout timing (e.g. additional payments within a year due to revised ex-dates), to avoid overstating underlying yield
New Equity Portfolio – Portfolio Dividend Yield Distribution
| Yield Range (on cost) |
Value |
% of New Equity Portfolio |
| 0–3% |
RM 67.6 m |
33.75% |
| 3–5% |
RM 26.6 m |
13.28% |
| 5–10% |
RM 90.0 m |
44.93% |
| >10% |
RM 16.1 m |
8.04% |
| Total |
RM 200.3 m |
100.00% |
As mentioned in earlier letters, our long-term goal is to build what I think of as our own "mini Yangtze River" – a wide, steady network of dividend streams fed by a diversified collection of enduring businesses, rather than relying on a handful of large positions. I like this image because it captures both strength and resilience. A great river does not depend on a single stream. If one stream runs shallow for a time, many others continue to flow, carrying the river forward. In the same way, a broad base of income-producing investments helps us weather the inevitable dry spells that come with investing.
The cash that flows from these streams will be put to work with care. Part of it is returned to our shareholders. The rest is recycled back upstream – reinvested into new opportunities that can, in time, become streams of their own. Importantly, this steady current gives us the confidence to venture into less certain waters. We can allocate a portion of capital to higher risk-reward opportunities or deep value situations – investments that may take time, and patience, to reveal their worth. Not every stream will endure. But if the river as a whole continues to flow, it will carry us forward.
A Note on Risk
I completed a draft of this letter on April 2, about a year after President Trump's "Liberation Day" tariff announcement. Recent developments serve as a reminder of how quickly conditions can change. Events in the Middle East, trade tensions, shifting policies, and economic uncertainty have all contributed to a more volatile environment.
However, I should reiterate that we do not claim the ability – or the talent – to make meaningful forecasts about macroeconomic or geopolitical developments. While the current wave of negative headlines may well play out, it is also possible that policies could shift, rhetoric softens, and outcomes prove less severe than feared. As I shared in last year's letter, Howard Marks has accurately described macro forecasting as giving the "illusion of knowledge". While these developments matter, they are rarely knowable with enough precision to be useful in guiding our investment decisions.
In the face of such uncertainty, we focus on what we can control: i) Ensuring our portfolio consists of resilient businesses, ii) Maintaining zero debt – including avoiding leverage in our investments, and iii) Keeping a sizable war chest so that we can act when opportunities arise.
As at end-2025, we held around RM148.4 million in cash and cash equivalents, representing about 30.1% of our NAV of RM492.2 million, up from 23.1% last year. I believe this provides a comfortable cushion in the current environment. Should a significant correction occur in a market where we seek to build long-term exposure, we would be in a position to deploy capital quickly. If such opportunities do not arise, we will continue doing what we have always done: patiently and selectively seeking out pockets of value in the market.
That said, shareholders should remain mindful that extended market downturns do occur. In such periods, portfolio values can decline significantly – we should be prepared for the possibility of a fall of 50% or more. In more extreme circumstances, cash inflows may be sharply reduced and could, for a time, disappear altogether, making dividend payments impossible.
If, however, the businesses we own remain fundamentally sound, we believe they will endure. And in time, our portfolio should recover with them.
At The Office
We continue to operate with a small and focused team. The team's contributions, across investment research, financial reporting, operations and sustainability, are essential to what we do. Much of the work that matters is done quietly and without recognition – but not without impact.
We have also been actively exploring how advances in AI may support our processes. While still early, we are keen to learn and adapt where it makes sense.
Thank you
Finally, I would once again thank our shareholders for your continued trust. We do not promise extraordinary results, or claim special insight into the future. What we can promise is that we will continue to approach capital allocation with discipline, patience, and a long-term perspective.
We think of you not as investors, but as partners. And we will continue to manage the business with that in mind.
CEO
Lionel Liong Wei Li
3rd April 2026
|
| MANAGEMENT DISCUSSION AND ANALYSIS |
| |
|
|
OVERVIEW
JcbNext Berhad ("JcbNext") is an investment holding company. It owned and operated the JobStreet.com online job portal business from 2004 to 2014. In 2014, the job portal business was sold to SEEK Ltd for close to RM2 billion with the net proceeds paid as dividends to shareholders. Today, the Company has stakes in associates, 104 Corporation, the largest job site in Taiwan and Innity Corporation Berhad, a leading provider of interactive online marketing platforms and technologies in Malaysia. JcbNext also has quoted investments in Malaysia, Hong Kong/ China and other markets and owns an 8-storey office building in Kuala Lumpur.
2025 IN REVIEW
During the year, the Group generated revenue from services, rental of office space, dividends, interest and other investment income. The Group's revenue mix for 2025 and 2024 are as depicted below:
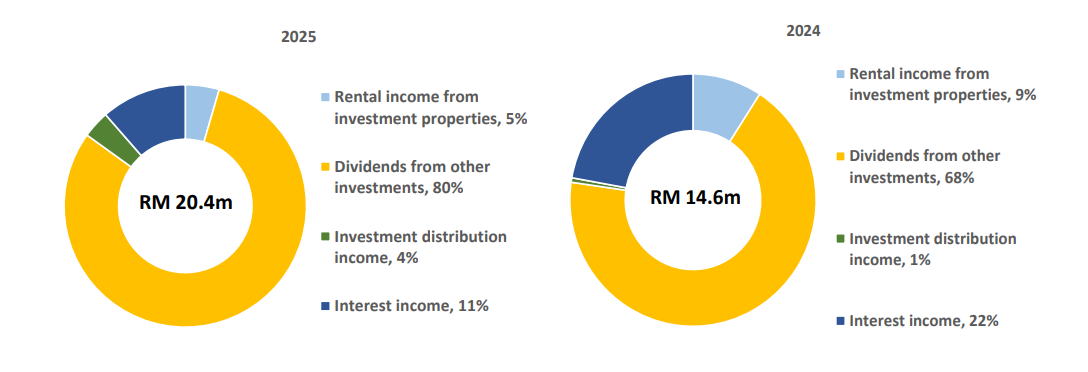
As the Group is principally in investment holding, the biggest contributor to group revenue is dividends from equity investments at 80% of revenue or RM16.38 million in 2025. This is followed by interest income at 11% and together with dividend income, contribute 91% of group revenue. Rental income and investment distribution income combined to contribute the remaining 9% of group revenue. The increase in the contribution of dividend income from 68% to 80% of group revenue in 2025 is in line with the Group's deployment of its cash to acquire equity investments over the last 4 years.
Total revenue had increased by 39.4% in 2025 primarily from an increase in dividend income from equity investments from RM9.96 million in 2024 to RM16.38 million in 2025. Dividend income from equity investments had increased by 64.5% year-on-year as the size of the new equity portfolio increased from a total cost of RM147.5 million at the end of 2024 to RM175.0 million at the end of 2025 as a result of additional investments made during the year. During 2025, the Group continued to receive dividends amounting to RM7.30 million from its associate, 104 Corporation ("104 Corp"), although such dividends are not accounted for as revenue.
Interest income had decreased by 28.2% YoY from RM3.24 million in 2024 to RM2.32 million in 2025, partly due to higher allocation in money market funds – which increased from RM20.40 million at the end of 2024 to RM42.62 million at the end of 2025 – and partly due to the general decrease in interest rates in 2025. Taken together, interest income and investment distribution income decreased 7.7% from RM3.32 million in 2024 to RM3.07 million in 2025.
Rental income from the Group's sole investment property, namely Wisma JcbNext, decreased 31.0% to RM0.92 million in 2025 from RM1.33 million in the preceding year. The tenant for 87% of the net lettable area in Wisma JcbNext has moved out on 31 August 2025 and the building is vacant since then, save for the space retained by the Company for its own use. The Company is currently working with real estate agents to procure new tenants.
The Group's operating expenses in 2025 amounted to RM10.22 million, an increase of 29.6% compared with the previous year's operating expenses of RM7.89 million. This was predominantly due to foreign exchange losses which are included in operating expenses. The Group recorded foreign exchange losses of RM5.51 million in 2025, an increase of 68.3% from RM3.27 million in 2024. The foreign exchange losses were mainly from the Group's USD and SGD denominated bank deposits. During the year, MYR had strengthened against the USD and SGD from USD1:RM4.477 and SGD1:RM3.2885 at the end of 2024 to USD1:RM4.06 and SGD1:RM3.1555 at the end of 2025. In fact, the MYR had emerged as the top-performing currency in Asia in 2025.
Further breakdown of the Group's other operating expenses is as follows:
| Group |
2025
RM |
2024
RM |
| Foreign exchange losses |
5,506,494 |
3,271,445 |
| Professional fees |
905,924 |
935,401 |
| Directors' fees |
358,548 |
360,418 |
| Office expenses |
192,071 |
190,965 |
| Security costs |
185,623 |
179,691 |
| Utilities |
142,931 |
295,428 |
| Staff benefits |
177,258 |
128,400 |
| Quit rent and assessments |
65,357 |
65,693 |
| Travelling |
18,858 |
12,340 |
| Telecommunication |
11,823 |
11,846 |
| Insurance |
44,024 |
43,657 |
| Miscellaneous |
85,314 |
98,969 |
|
7,694,225 |
5,594,253 |
The Group continued to rely significantly on our associates, primarily 104 Corp, to contribute to the Group's earnings in 2025. As a leading provider of integrated human resource services in Taiwan, 104 Corp remains dominant in the online job portal, executive search, and HR consultancy services. Under evolving market conditions, 104 Corp's revenue in 2025 increased by 7.02% to NT$2.67 billion, compared with NT$2.50 billion in 2024.
While operating income contracted by 2.65% due to rising operating costs and expenses, the company's bottom line remained resilient. Profit before taxation increased by 5.78% YoY to NT$598.44 million (2024: NT$565.74 million). Net profit attributable to shareholders grew by 3.98% YoY to NT$488.05 million, up from NT$469.36 million in the preceding year. After-tax Earnings Per Share (EPS) rose to NT$14.70, compared to NT$14.14 in 2024. The Board of 104 Corp has maintained its commitment to shareholder returns, approving a cash dividend of NT$14.70 per share for 2025, representing a 100% payout ratio of the year's net income, totalling NT$488 million, pending approval at the Annual General Shareholders' Meeting on 27 May 2026.
Our investment in 104 Corp continues to be long-term in nature, centred on deriving consistent dividend income. While we have previously reduced our stake to manage concentration risk, bringing our interest to 8.42% as of the end of 2025, we continue to monitor the company's leadership in the Taiwanese market. During the year, the Group recorded gains on disposal of 104 Corp's shares amounting to RM30.92 million. Going forward, the pace and quantum of selling 104 Corp shares will depend on our need to reduce concentration risk and the liquidity of the stock. In line with the reduction of the Group's equity interest in the company, our share of profit from 104 Corp in 2025 amounted to RM7.95 million, down 28.9% from RM11.17 million in 2024. As mentioned earlier, the Group received dividends amounting to RM7.30 million from 104 Corp in 2025, down 26.0% compared with RM9.86 million received in 2024, due to the lower shareholding despite 104 Corp paying a higher dividend per share.
Our other associate, Innity Corporation Berhad ("Innity"), provides technology-based online advertising solutions across the Asia Pacific region. Serving as a one-stop centre for Creative, Media, and Research, Innity has maintained its listing on the ACE Market of Bursa Malaysia since 2008 and continues to operate regionally. The challenging environment for the company's digital advertising business persisted into 2025, leading to a significant contraction in Innity's top-line performance. The group's unaudited revenue declined by 20.8% to RM88.89 million in the 12-month period ended 31 December 2025, compared with RM112.17 million in FY2024. The group's unaudited loss attributable to shareholders widened to RM8.47 million, compared to RM7.31 million in the preceding year. This resulted in an increased loss per share of 6.08 sen (FY2024: 5.24 sen). Our share of loss from Innity in 2025 increased to RM1.84 million from RM1.54 million in 2024, reflecting the deeper net loss. As at 31 December 2025, the Group's equity interest in Innity remained at 20.98%.
Overall, the Group's net profit attributable to shareholders for 2025 contracted 15.6% YoY to RM43.13 million from RM51.12 million in 2024, despite the increase in revenue. As explained earlier, firstly, this was due to higher foreign exchange losses in 2025 due to the strengthening of MYR against the USD and SGD. Next, the gains on disposal of 104 Corp's shares amounting to RM30.92 million in 2025 was down 9.1% compared with RM34.03 million recorded in 2024. Although this was mainly driven by market conditions dictating the liquidity and prices of 104 Corp's shares, it would nevertheless have a material impact to the bottom line of the Group. On the same note, the continued disposals of 104 Corp's shares have lowered our stake in the company, resulting in a decrease in the share of profits from the company from RM11.17 million in 2024 to RM7.95 million in 2025. While our other associate, Innity, continued to record losses in 2025, due to persistent losses and a protracted slump in its share price, we have also recognised an impairment loss amounting to RM3.76 million. Another contributor to the decrease in net profit for 2025 is the decrease in the fair value of investment property amounting to RM500,000 (2024: an increase of RM500,000). Excluding the gains on disposal of shares of 104 Corp, the impairment loss on Innity and the decrease in the fair value of investment property, the adjusted net profit attributable to shareholders for 2025 would have been RM16.47 million (2024: RM16.60 million).
Although earnings per share amounted to approximately 32.91 sen per share (2024: 38.83 sen), the Company will continue to pay dividends based on its free cash flow ("FCF"). The Group's FCF for 2025 amounted to RM18.69 million, up 3.4% from RM18.08 million in the preceding year. The increase in FCF was attributed to higher dividends received from equity investments as well as distribution from a private equity fund. To this end, the Board has recommended the payment of a final dividend of 7.25 sen per ordinary share to be paid after the forthcoming AGM.
The Group's net assets attributable to shareholders grew by 12.8% YoY to RM450.73 million as at 31 December 2025 compared with RM399.72 million at the end of the previous year. On a per share basis, this translates to RM3.44 per share with the Company's shares quoted at a price of RM1.80 as at 31 December 2025.
OVERVIEW OF ASSETS UNDER MANAGEMENT
The Group's assets under management comprise of:
| Group |
2025
RM’000 |
2024
RM’000 |
| Investment properties |
18,000 |
18,500 |
| Investments in associatesˆ (at market value) |
|
|
| - 104 Corporation |
81,108 |
134,207 |
| - Innity |
6,581 |
9,945 |
|
87,689 |
144,152 |
| Financial assets at fair value through other comprehensive income |
|
|
| - Lion Rock |
36,303 |
39,951 |
| - Other investments |
205,892 |
164,065 |
|
242,195 |
204,016 |
| Financial assets at fair value through profit or loss |
|
|
| - Money market unit trust funds |
42,622 |
20,400 |
|
42,622 |
20,400 |
| Cash reserves |
|
|
| - USD |
41,533 |
29,223 |
| - HKD |
4,909 |
1,304 |
| - SGD |
55,556 |
54,148 |
| - RM |
1,402 |
1,121 |
| - Others |
2,345 |
1,002 |
|
105,745 |
86,798 |
| Other receivables, prepayments and other assets |
3,397 |
578 |
|
499,648 |
474,444 |
^ In the audited financial statements, investments in associates are accounted for using the equity method pursuant to MFRS 128, Investments in Associates and Joint Ventures
The Group’s assets under management (“AUM”), which comprise investment properties, equity
investments, associates at market value and cash and cash equivalents, grew 5.3% to RM499.65 million
as at 31 December 2025 compared with RM474.44 million in the previous year. The increase in AUM
arose from dividends from equity investments including from 104 Corp, interest income, rental income,
net increase in the fair value of equity investments including associates and after deducting operating
expenses and share buy backs.
The performance of the Group's associates has already been detailed in the previous section of this report. The carrying value of the investments in associates on the Group's balance sheet decreased by 41.4% to RM46.23 million in 2025 from RM78.87 million a year ago. Against the Taiwan dollar, the Ringgit had strengthened from NT$1:RM0.1363 as at end 2024 to NT$1:RM0.1293, and this contributed to a decrease of RM2.16 million in the carrying value of 104 Corp on our balance sheet. Disposals of 104 Corp shares during the year also contributed to a decrease of RM25.69 million in the carrying value of 104 Corp. The dividend received from 104 Corp during 2025 based on its 2024 net profit, which amounted to RM7.30 million, also contributed to the decrease in carrying value. As mentioned in previous years' Annual Reports, while the dividend from 104 Corp being an associate does not benefit the Group's bottom line, the dividend provides liquidity for the Group to fund its working capital requirements and dividend payment to shareholders. The dividend from 104 Corp alone accounted for 31% of total dividends received by the Group in 2025. Share of profits from associates amounting to RM6.11 million in 2025 partially offset the decrease from the aforementioned factors.
The largest investment under the FVOCI category is Lion Rock with a carrying value of RM36.30 million. Lion Rock is principally involved in the provision of printing services to international book publishers, trade, professional and educational conglomerates and print media companies. This is a business that the Group had invested in from 2011 to 2013 at a total cost of RM2.98 million as it had a recruitment advertising business in Hong Kong which we believed had strategic value to our JobStreet business. Subsequently, in 2014, Cinderella Media Group Ltd, the parent company of Lion Rock at that time in which we had a stake in then, rewarded its shareholders by declaring a dividend-in-specie of its stake in Lion Rock and spinning it off as a separate listed company on the Hong Kong Stock Exchange. As a result of that, the Group's stake in Lion Rock had increased by an additional 36.5 million shares in 2014. At the end of 2025, the Group held an equity interest of 6.55% in Lion Rock, down from 7.03% at the end of 2024 due to partial divestment in 2025. During the year, the Group received RM3.79 million in cash dividends (2024: RM3.81 million) from Lion Rock. On 30 March 2026, Lion Rock announced second interim dividend amounting to HK$0.09 per share (2024: HK$0.08) to be paid on 30 April 2026. Despite an appreciation of its share price from HKD1.28 at the end of 2024 to HKD1.38 at the end of 2025, the carrying value of the Group's investment in Lion Rock had decreased by 9.1% partly due to disposals and partly due to the strengthening of the MYR against the HKD.
Due to market conditions, 2025 was a relatively slower year for the Group as far as investments go. During the year, the Group had invested an additional RM31.50 million (2024: RM61.11 million) into its investment portfolio. As mentioned in our previous Annual Reports, this portfolio, referred to as the Equity Portfolio, excludes Lion Rock, Hastings Technology Metals Limited ("Hastings"), the associates and the unquoted investments. Most of the companies in the Equity Portfolio are listed in Malaysia and Hong Kong/ China with a small portion in other markets. As at 31 December 2025, the top 5 holdings made up 36% of the Equity Portfolio while another 28 stocks made up the remaining 64%. These investments as well as other targets emanated from research conducted internally in line with the Group's investment objectives. The Equity Portfolio generated approximately RM12.59 million in dividends for the Group in 2025 (2024: RM6.15 million). As at 31 December 2025, the fair value of the Equity Portfolio amounted to RM200.32 million, up 26.3% from RM158.59 million a year ago. As with previous years, the identities of the component stocks will be kept confidential save for any laws or regulations that require the Group to provide full disclosure.
|
Cost of Investment
RM |
Carrying Value
RM |
Fair Value
RM |
| 104 Corporationˆ |
27,559,129 |
40,297,156 |
81,107,528 |
| Innityˆ |
8,487,984 |
5,937,187 |
6,581,259 |
| Lion Rock |
16,580,220 |
36,302,812 |
36,302,812 |
| Other equity investments |
197,750,769 |
205,892,522 |
205,892,523 |
| |
250,378,102 |
288,429,677 |
329,884,122 |
^ Accounted for using the equity method pursuant to MFRS 128, Investments in Associates and Joint Ventures
Looking at the table above, the fair value of all of the Group's equity investments combined including its listed associates as at 31 December 2025 was significantly above total cost owing to the large unrealised gains on 104 Corp and Lion Rock (please be reminded that the unrealised gains on 104 Corp, as an associate, have not been recognised in the financial statements at all).
The Group's treasury management objectives are to ensure there is available liquidity when needed and to preserve our long-term purchasing power to acquire investments. In that respect, the Group has decided that the main currencies that it will maintain are MYR, USD, SGD and HKD. While the holding of such currencies may result in foreign exchange gains or losses and thus volatility to our P&L, the Group does not intend to actively trade currency positions nor engage in any speculative activities. The Group's MYR cash is placed mainly in money market unit trust funds while its USD, SGD and HKD cash are placed mainly in interest-bearing bank deposits. While the Group manages its treasury function conservatively to safeguard the Group's interests, the focus of the Board and management is still on identifying new strategic investments and/or developing a broad portfolio of investments that can contribute to the future growth of the Group. To be able to capitalise on any opportunities as and when they arise without sacrificing unduly on the Group's returns on its reserves, the Group will need to maintain an appropriate mix of long and short-term investments and cash.
FUTURE PLANS AND PROSPECTS
In this environment of uncertainty and high volatility amidst heightened geopolitical tensions, we continue to maintain a disciplined investment strategy focused on building a diversified portfolio of long-term equity investments that generate stable dividend income. This approach is designed to weather market volatility while ensuring sustainable returns for our shareholders. While market conditions have presented challenges, we continue to view volatility as an opportunity to acquire high-quality assets at attractive valuations. Should markets present favourable entry points, we stand ready to deploy additional capital into strategic investments that align with our long-term objectives. As we move further into 2026, we will continue to navigate these uncertain times with prudence, focusing on value, resilience, and sustainable income generation. While trade tensions, geopolitical risks, and economic uncertainties persist, we remain opportunistic in identifying investment opportunities that align with our long-term goals. The Group also remains committed to delivering steady dividend income to shareholders while maintaining a vigilant stance on risk management. We believe that our disciplined approach will allow us to capitalise on market opportunities while safeguarding against potential downturns in this unpredictable economic environment.
|
| |
|
|
|
|
